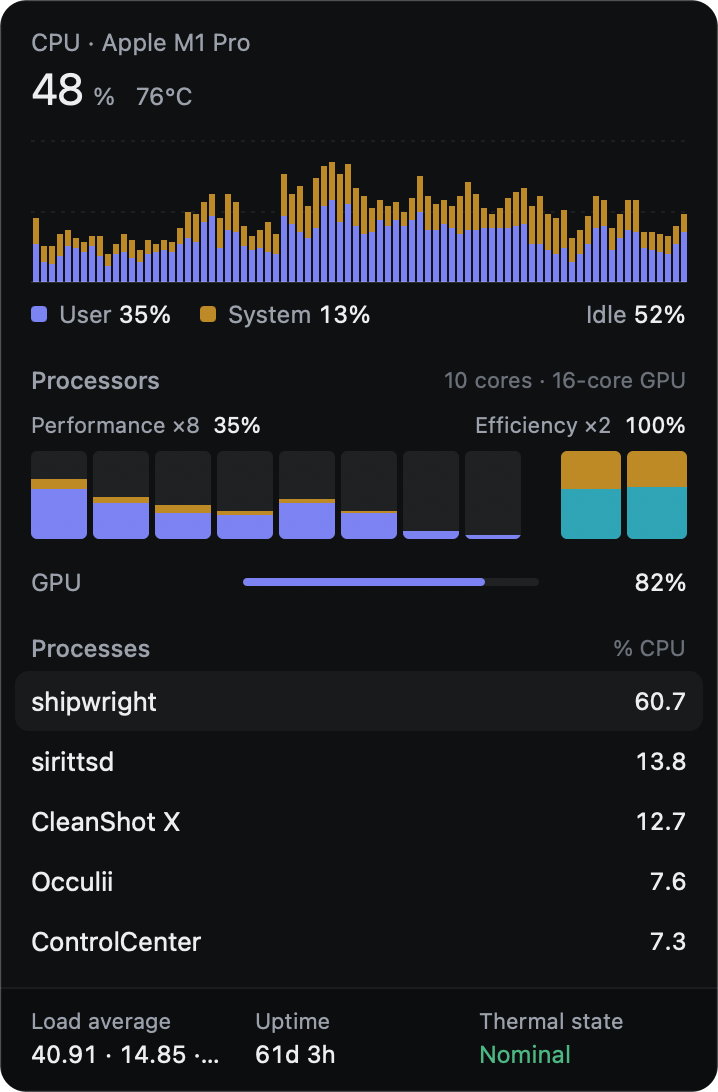
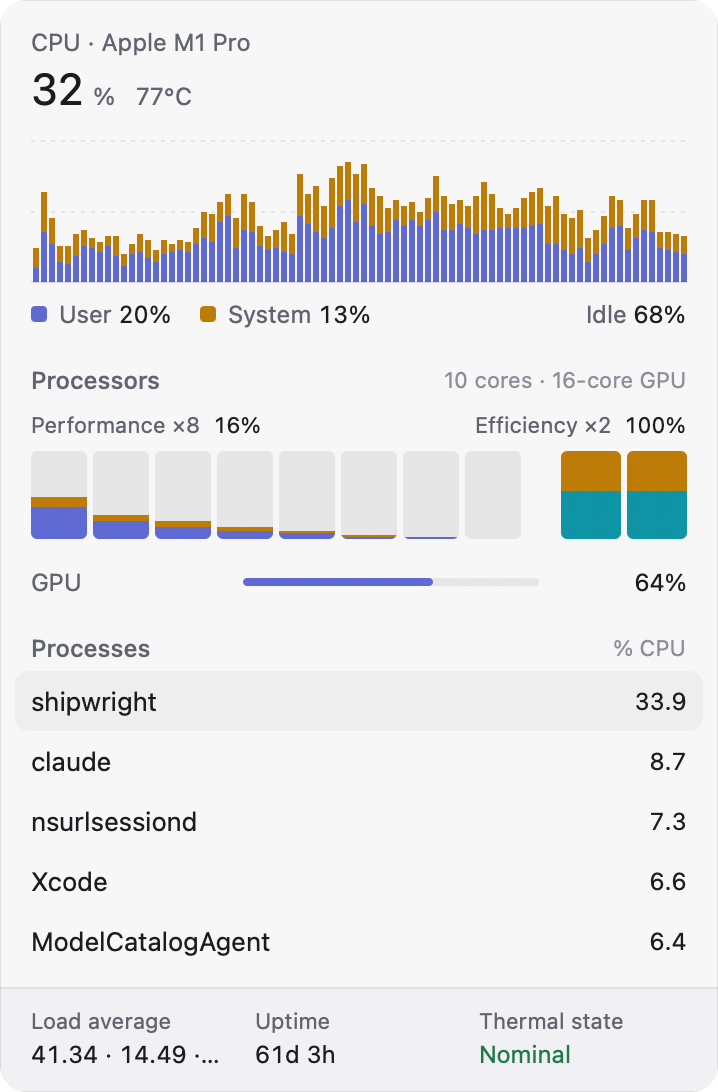
Clusters, cores and GPU
Per-core bars grouped by cluster, read from the chip itself, with load average, uptime and thermal state underneath.
Occulii · v0.2.0 is out →
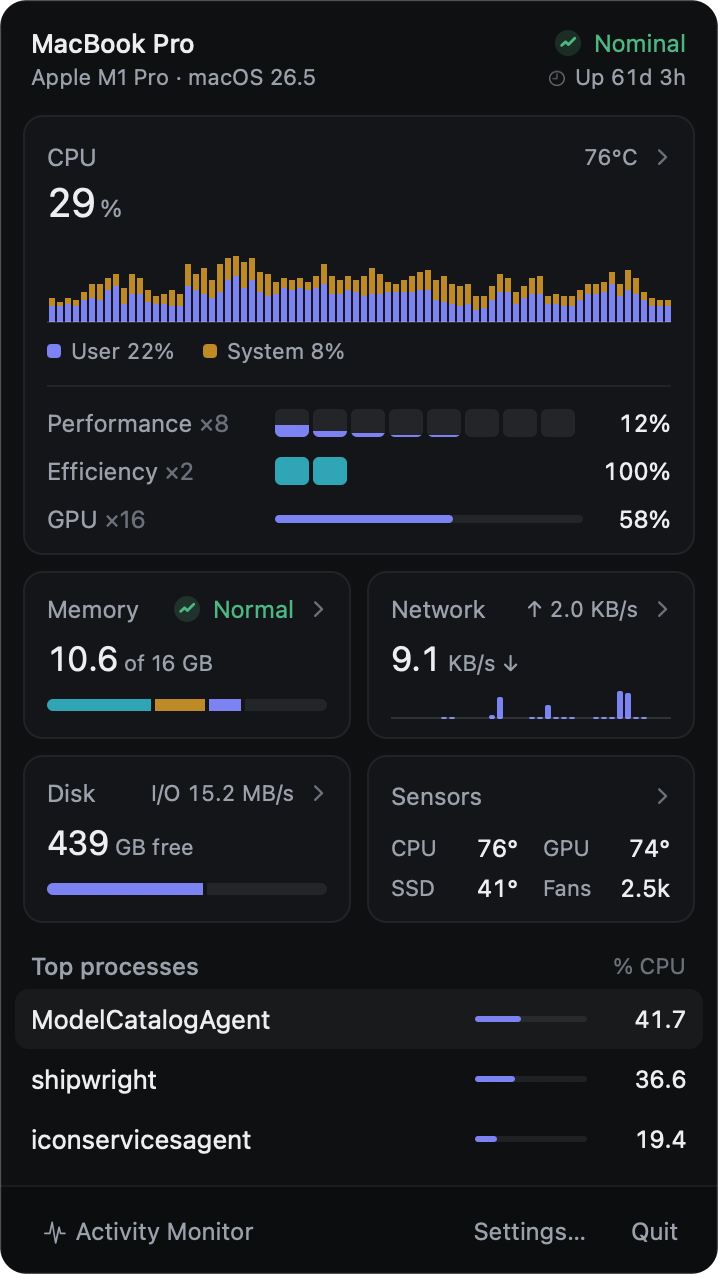
Occulii is a menu bar system monitor. CPU, GPU, memory, network, disk and sensors live in one panel behind a single item, and any tile opens its full detail beside it. It does all that on a fraction of a percent of one core.
Signed & notarized · macOS 15+ · Apple Silicon

Read straight from macOS on your Mac. Nothing leaves it.
Hover a tile and its detail opens beside the panel. No row of six icons crowding your menu bar.
Fast readings every tick, slow ones less often, and process scans only while a panel that lists them is open.
Release build, default settings, two-second refresh. It sleeps when your display does.
1.0 Processor
Apple Silicon splits work between performance and efficiency cores. Occulii shows each cluster and each core, user and system load as stacked history, GPU load beside it, and the processes doing the work.
Per-core bars grouped by cluster, read from the chip itself, with load average, uptime and thermal state underneath.
CPU, Memory, Network, Disk and Sensors can each have a menu bar item in graph, value or glyph-only style.
2.0 Memory & network
“Used memory” on a Mac is mostly cache. Occulii leads with memory pressure, the number macOS itself acts on, then breaks down app, wired and compressed memory and swap. Network shows live throughput per direction with its own history.
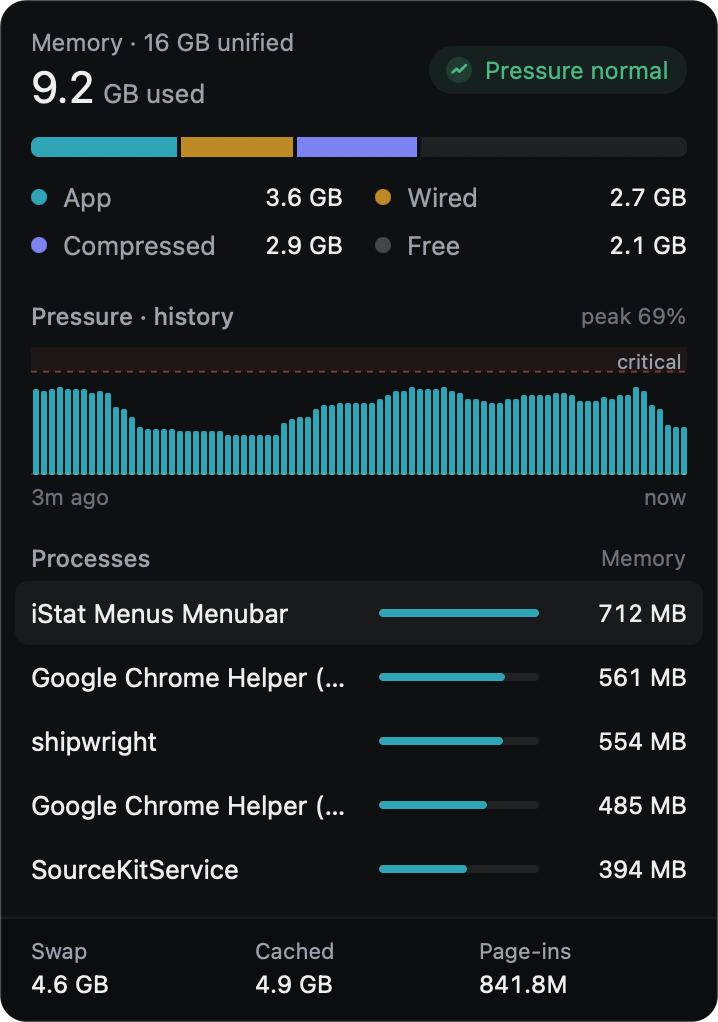
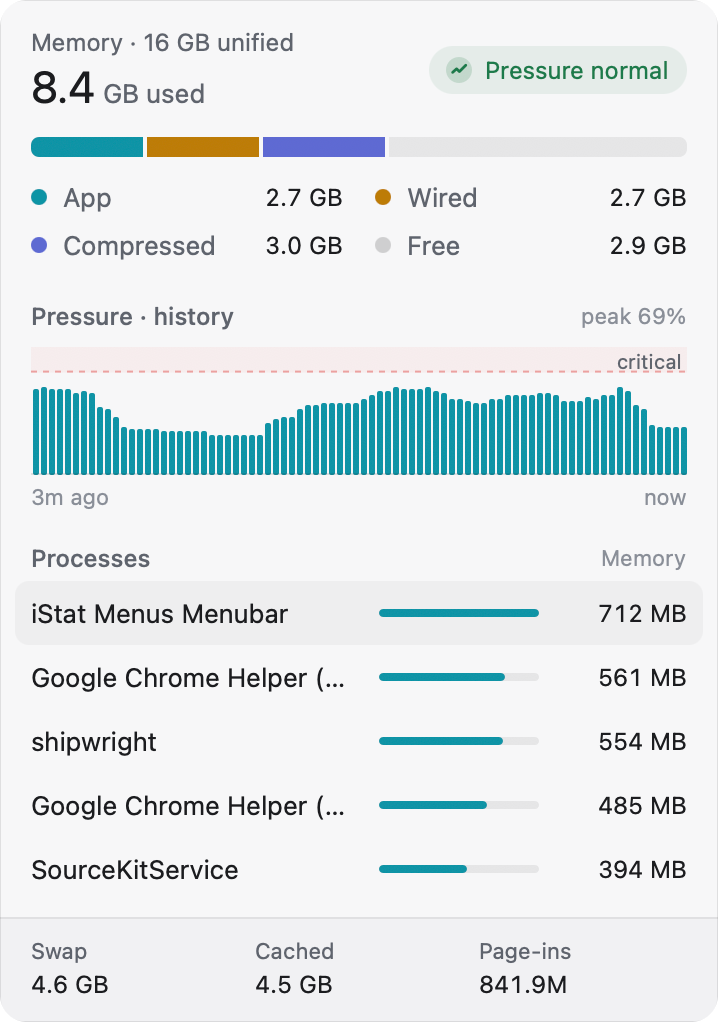
Pressure with history, the composition bar, swap, and who's holding the most.
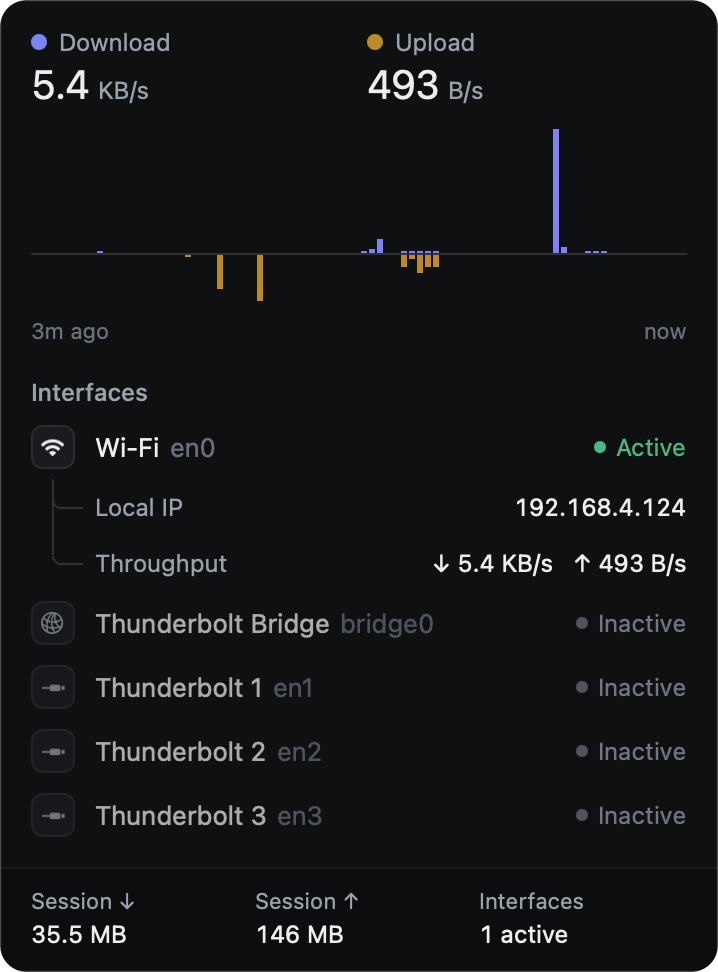
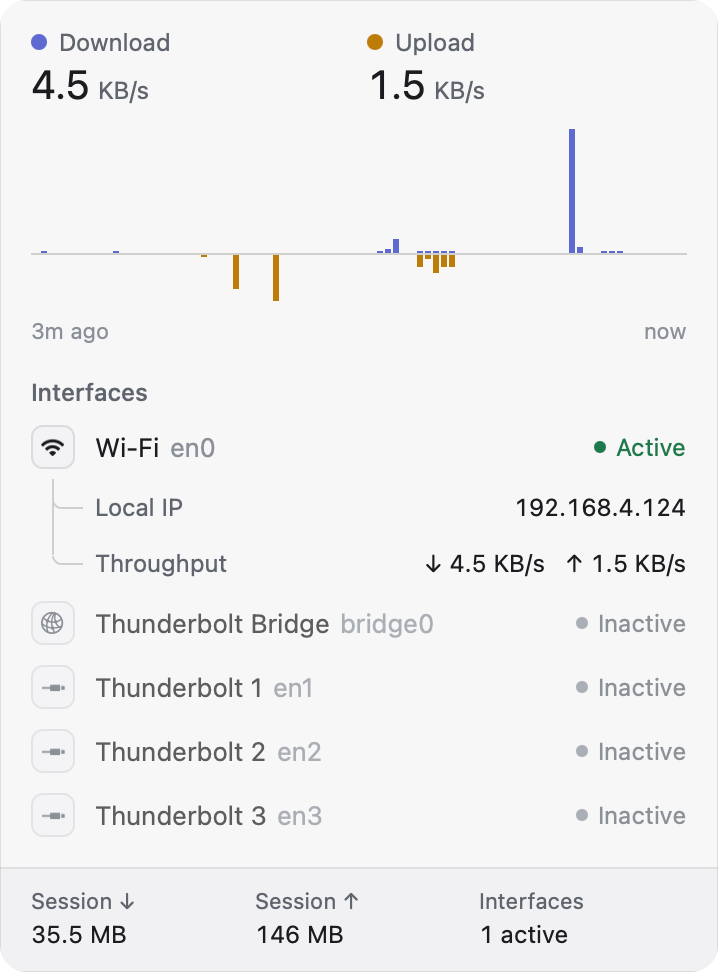
Download and upload mirrored around one baseline, each active interface, and session totals.
3.0 Disk & sensors
See how much room is left on every local volume, what your disks are reading and writing right now, and which apps are doing it. Temperatures are grouped the way the chip is built, with fans and battery alongside.
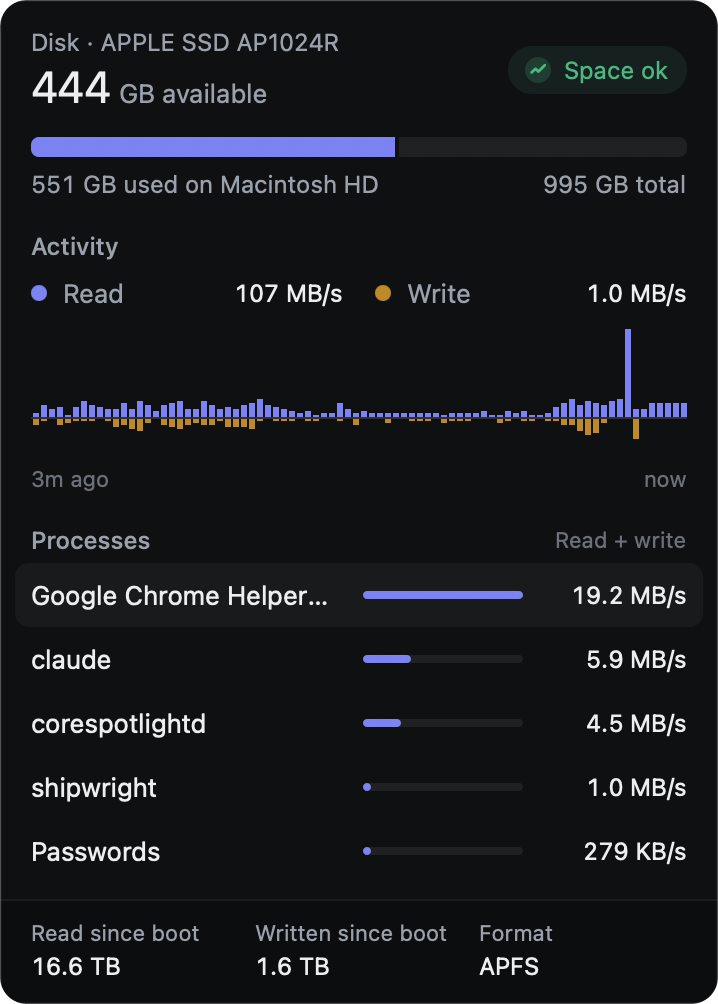
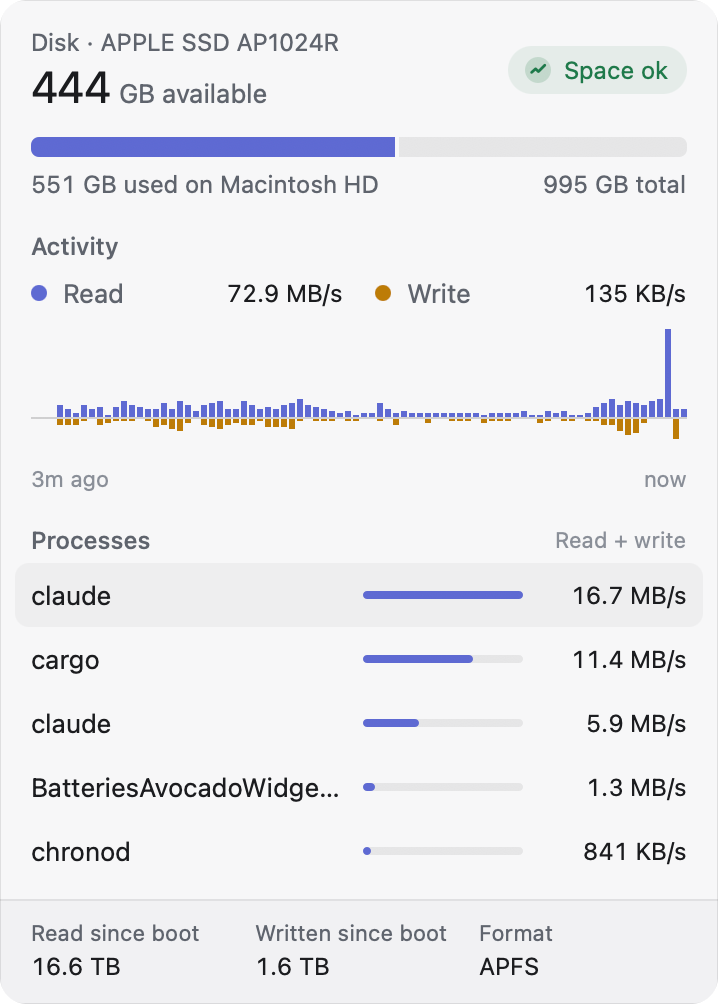
Free space on every local volume, read and write rates with history, and bytes moved since boot.
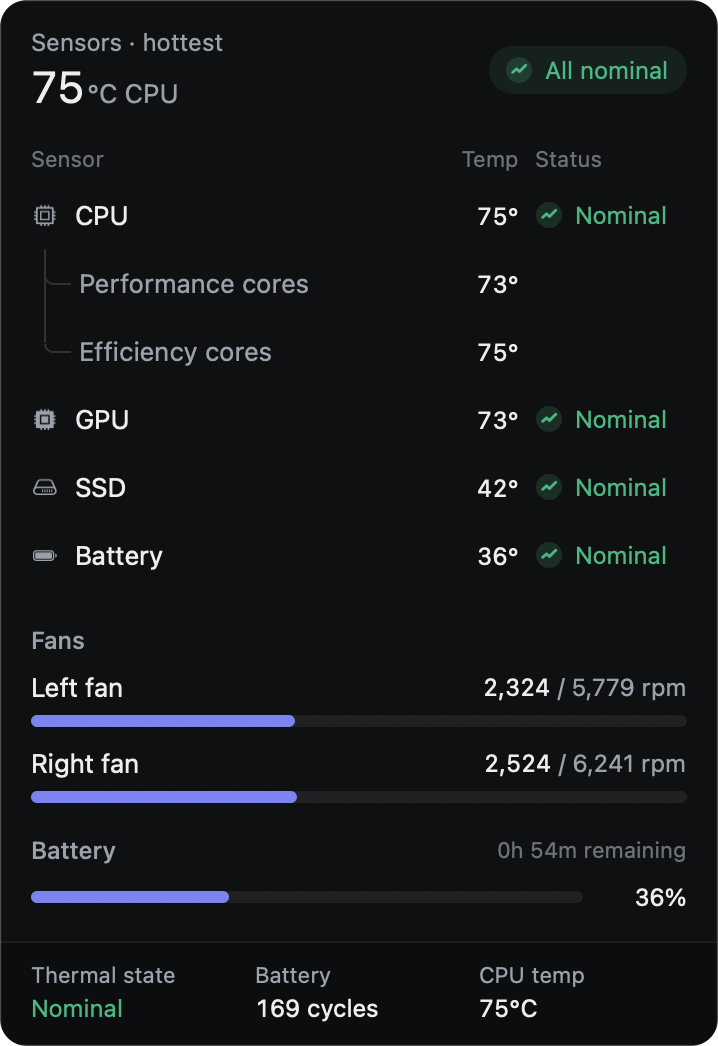
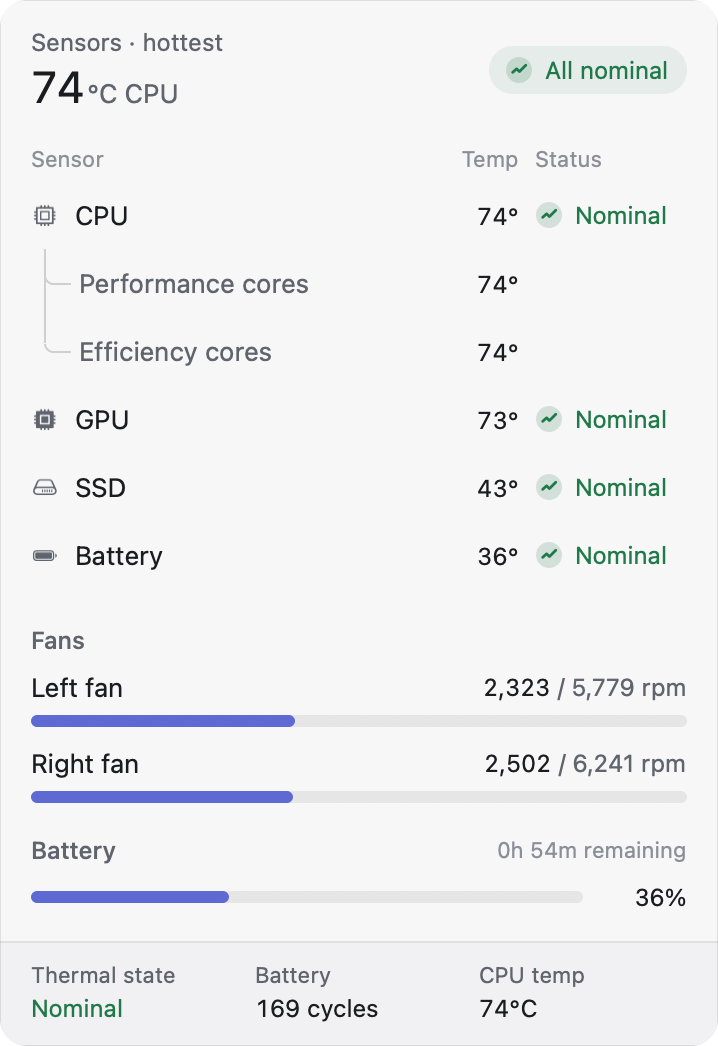
Core, GPU, SSD and battery temperatures with status, fan speeds, and battery charge and cycles.
4.0 Details
Occulii is a native AppKit app with no helpers, daemons or kernel extensions. It lives in the menu bar, not the Dock.
Which items show and how, appearance, refresh interval, temperature unit, accent color and launch at login. That's it.
4.1
Panes open after a short hover pause, so the pointer can cross other tiles without flipping them. Click a tile to toggle its pane; Escape closes.
4.2
Nominal, warm and hot always come with an icon and a label, never color alone.
4.3
Items only redraw when what they show actually changes, and keep a steady width so neighbours don't jump.
4.4
No account, no analytics, no network calls. Everything comes from macOS on your Mac.